The problem
Property investors underwrite deals in spreadsheets they built themselves. Those spreadsheets work well enough until you want to ask a different question of them.
The same house evaluated as a long-term rental, as a BRRRR, and as a flip needs three separate models. The cash flows differ, the exit assumptions differ, and the word “return” does not mean the same thing across them. In a spreadsheet that means three files, three sets of copy-pasted assumptions, and no reliable way to compare them. When a mortgage rate assumption changes, some of those files get updated and some don’t.
What I built
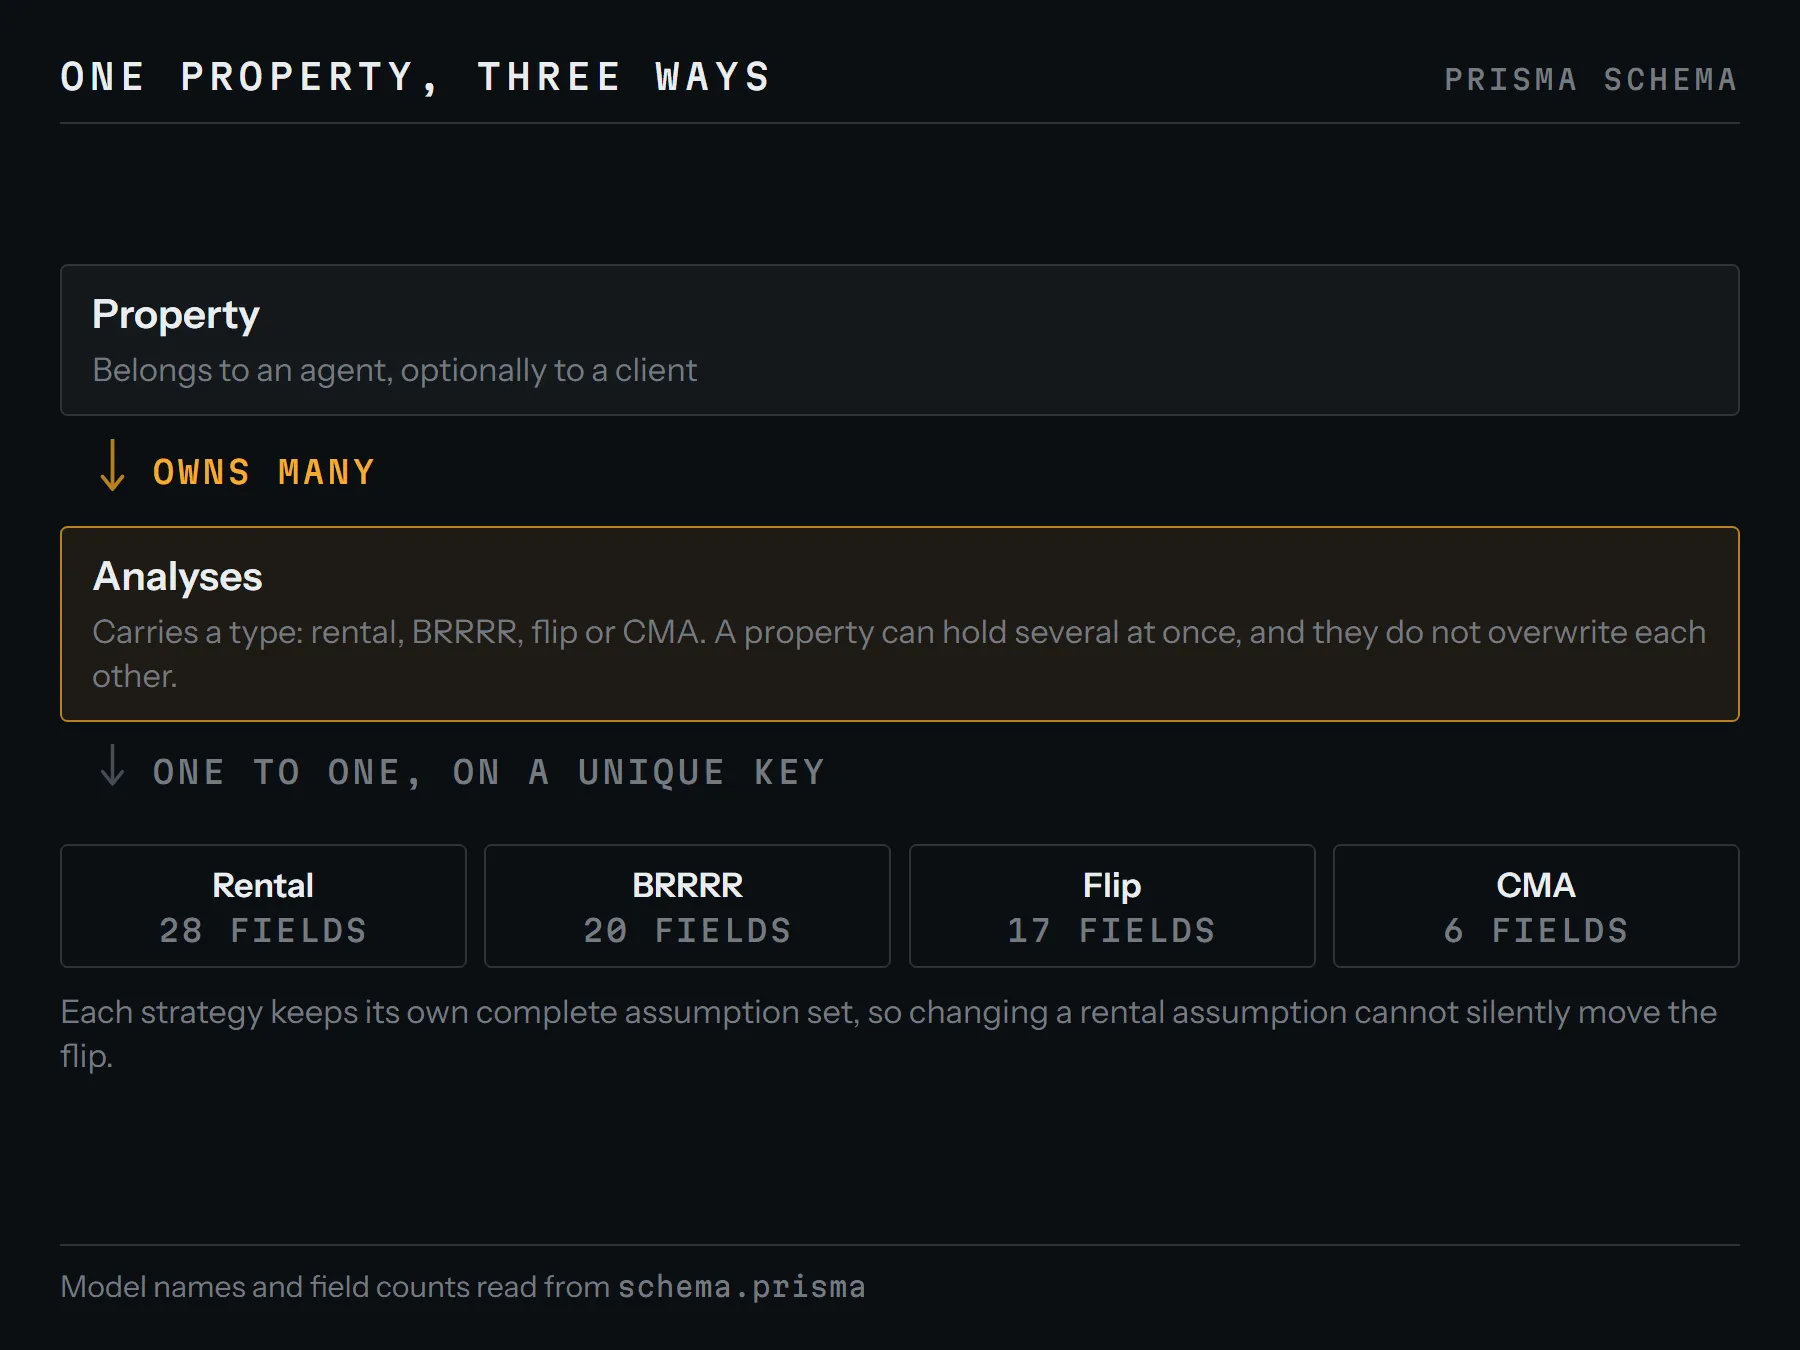
NextDealIQ models the property once as the top-level entity, then attaches analyses to it. Each analysis is typed by strategy and carries its own model, so the same property can be underwritten three ways from a single source of truth about the building.
The dashboard puts those analyses side by side. Assumptions are first-class and editable, so you can find the number driving a return, change it, and watch the effect on the other two.
Where it is
The software works. You can model a property, run all three strategies against it, change an assumption, and watch the comparison move. I can demo that today.
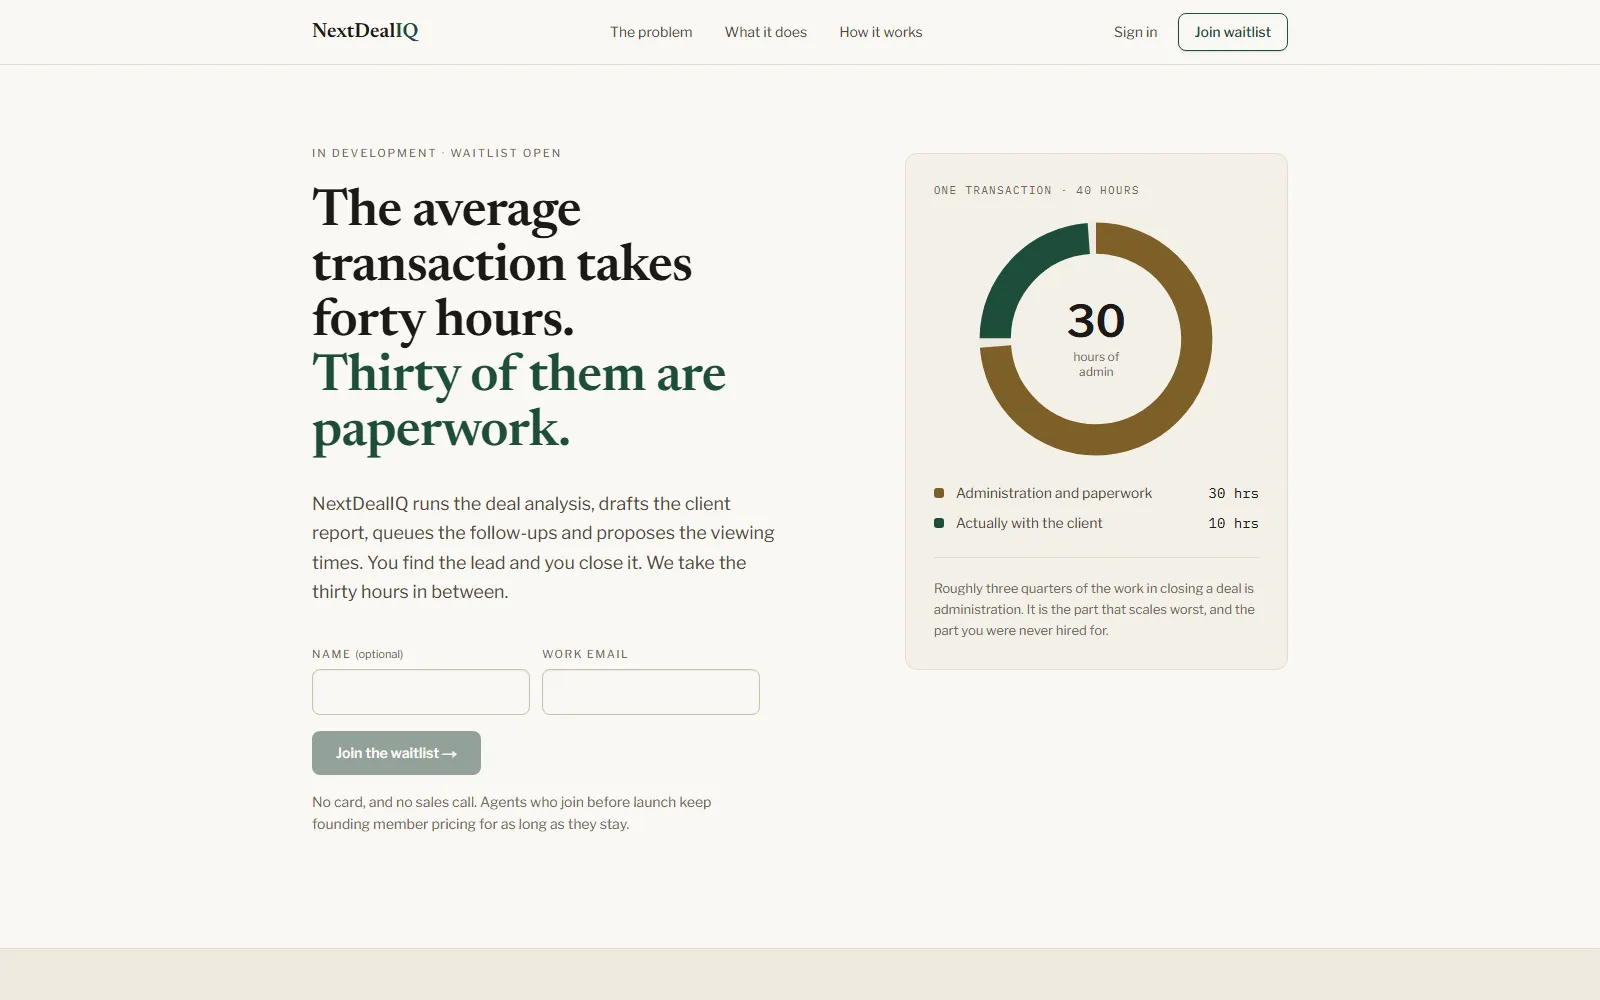
The launch is what remains unfinished. nextdealiq.com is live with a landing page, a posted founding-member price and a sign-up form, collecting interest while I work through onboarding and getting confident enough in the numbers to put them in front of someone about to spend money.
That distinction carries more weight here than on most projects. A dashboard that is wrong by a rounding convention still looks plausible, and the person reading it is deciding whether to buy a house. Finished engineering and a ready product are two different states, and this one is in the first.
What I’d revisit
The financial models are correct, and they are hard-coded. A user who wants to underwrite with an assumption I did not anticipate has to wait for me to add it. Turning the strategy models into data instead of code is a bigger rewrite than it sounds, which is why it has not happened yet.
Media
How this was built
The spec sheet above lists the stack. This section covers how the work was run, which a screenshot cannot show you.
Where AI did the work
- Drove the schema and the API surface as one unit, so the generated route handlers and the Prisma schema could not disagree about the shape of a deal. A property owns many analyses, and each analysis carries its own strategy-specific model.
- Used agent passes for the mechanical breadth (CRUD routes, form wiring, component scaffolding) and kept the financial models under manual review.
The discipline around it
- Integration points are written down: what the API expects from the session, what the dashboard expects from the API. Reading the code to work it out is slower and goes stale.
- Vitest coverage concentrates on the calculation layer, where a silent error is both expensive and invisible.
What stayed human
- Every underwriting formula was hand-verified against a worked example before it shipped. An AI-written cap-rate calculation that is off by a rounding convention will still look plausible on screen, and someone may buy a house on the strength of it.
- Auth and data isolation between users were reviewed manually rather than trusted to generated code.
- Launch waits on my own confidence that the numbers hold up in front of an investor. The build has been done for a while; that is a separate question.